Daten & Statistik Services
Our department Integrative Risk Assessment, Data and Statistics is not only responsible for statistical tasks and data management within AGES, but has been successfully offering its services for years. Here you can get an overview of our portfolio.
Questionnaire surveys
In addition to laboratory or field measurements, data is also obtained through surveys of consumers, companies, stakeholders, etc. We have a lot of experience in empirical social research and in the customer-oriented technical implementation of surveys. The choice of the appropriate survey instrument and the development of the same require expertise and experiential knowledge. The expertise from the disciplines of sociology, psychology and statistics in the development of survey instruments (especially questionnaire surveys) includes:
- Design and implementation of empirical studies (quantitative, qualitative)
- Clear and comprehensible formulation of research questions and construction of suitable question formats
- Representative sample design
- Survey concepts that are oriented towards the survey objective and take into account the subsequent evaluation of the data
- Comprehensive evaluation concepts up to automated reporting
Survey tools
Surveys using paper or personal interviews are increasingly being replaced by electronic forms. These offer the advantage of easy dissemination as well as rapid data evaluation. We offer the following services for the professional implementation of empirical surveys:
- EXCEL questionnaires, which are characterized by user-friendliness and input security
- web-based surveys by means of online survey tools, which allow anonymous surveys
Sample planning
Data collection by means of sample surveys is of inestimable importance in the scientific and economic field as well as in official control. A well-considered sample design decisively ensures the quality of survey results. Non-representative surveys, on the other hand, can lead to incorrect results and conclusions. In practice, therefore, the distinction between representative and risk-based samples is essential. Sample design is one of our core competencies, especially for the following issues:
- Size of the sample: as few as possible, as many as necessary - depending on the survey objective and available resources.
- Structure of the sample: representative composition, for example through stratification
- Selection of sampling units: Selection of establishments, stocks, spatial units, persons, etc., by random sampling methods
Study Planning
Statistical planning of scientific studies contributes significantly to the success of such projects. Our services include:
- Mathematical-statistical system analysis in the design phase: consistency of study objective, data collection, measurement procedures, and data analysis.
- Study-specific sample design and representative and efficient selection of sampling units
- Method planning: advice on the selection of appropriate statistical analysis procedures
Control system design
The control and monitoring of risks is one of the main objectives of official control systems, but also of individual farm self-control systems. We can refer to a wealth of application experience in the fields of agriculture, veterinary, food safety and human health.
Service description
- Design of control systems according to representative and/or risk-based criteria
- Design of control systems to demonstrate freedom from disease
- Control plans taking into account legal requirements, statistical safety criteria, capacity constraints and control objectives
- Automated target/actual comparisons for monitoring control implementation
- Development of data-based indicator systems for control results
- Development of a regular reporting system
- Statistical analysis of the collected data: (two-stage) prevalence estimation,
- Estimation of intra-herd prevalence, etc.
Data Management
Data management tasks are diverse and range from master data maintenance in the company's own laboratory information system to complex data preparation for various stakeholders. This requires high-performance databases to be operated in the background. Our department of Integrative Risk Assessment, Data and Statistics has a great deal of expertise in the architecture, design and operation of databases.
Data processing and transmission
Service description
The laboratory data collected at AGES provide an incredibly important basis for answering health-related questions. Therefore, these data must also be transmitted to many bodies at national but also international level.
Professional tools are used for data selection. In order to meet the requirements of important data recipients, the data often have to be translated. This "translation" not only concerns the language, but above all the adaptation to standards with defined value lists and codes. In order to be able to handle these complex processes efficiently, a very high degree of automation has already been achieved for many data deliveries. This is done, for example, by maintaining and updating various mapping catalogs that enable data to be quickly translated from its original form into permissible values for the recipient. The data is largely transmitted in XML format. Before delivery, the created files are checked against the XSD schema.
Design/construction of databases
Service description
We maintain our own evaluation environment. This includes AGES internal data from our own laboratory information system as well as external databases. For this purpose, the data from the source systems must be made available as files, interface tables or via a view layer so that they can subsequently be loaded, cleaned and integrated in the core. All these data flows are summarized under the term ETL (Extraction, Transformation, Loading) and controlled with appropriate tools.
Our team includes database experts who have many years of experience in setting up and further developing complex evaluation structures.
Analysis of trade networks
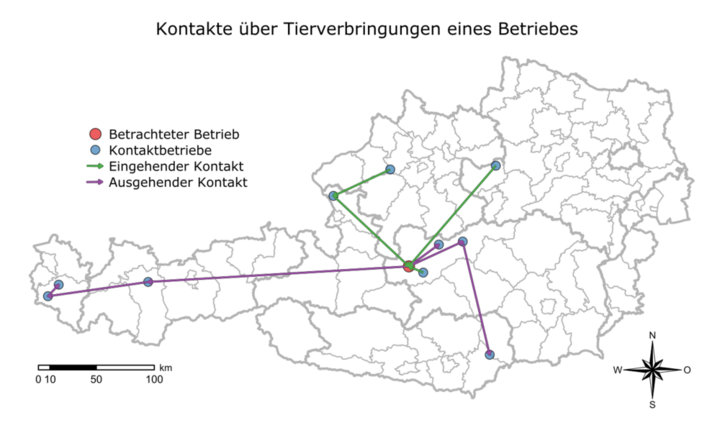
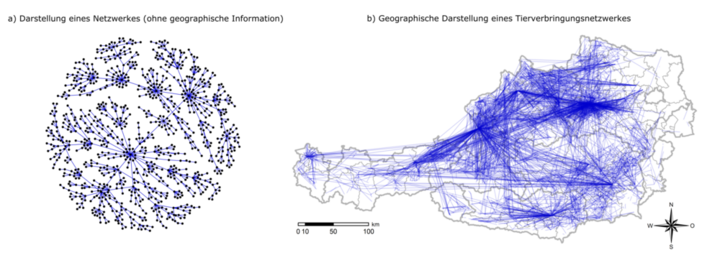
The animal trade is characterized by intensive national and international linkages. The movement of live animals is a major route of transmission for many animal diseases. Depending on the structure of the trade network, diseases can spread at different rates. By analyzing animal movements, surveillance programs can be optimized, but also risk management measures can be prepared in case of crisis. Based on VIS and TRACES data, we can perform the following analyses:
Individual movement analyses:
- What is the chain of contact for an individual farm or animal?
Total movement analyses look at the entire trade network:
- Which companies play an important role in the network?
- How strong are the linkages in the network? Are there regional differences?
- Are there any conspicuous movement paths that are of particular importance in the event of an epidemic?
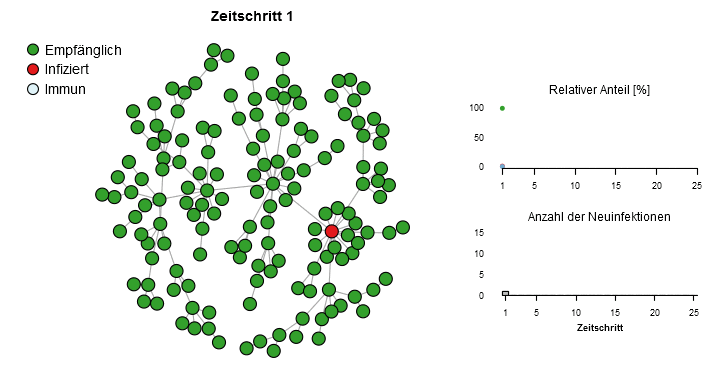
The spread of a disease is simulated in the example graphic. The example network is shown on the left. The graph on the top right shows the time course of the proportion of susceptible, infected and immune units (e.g. farms). The graph on the bottom right shows the number of newly infected persons per time step.
Statistical data evaluation
The evaluation of data using an extensive repertoire of statistical methods forms a core competence of our department. In accordance with the evaluation objectives, customized solutions are developed for the calculation of statistical key figures and their visualization by means of clear, meaningful graphics. In the analysis, we also take into account the uncertainties resulting from sample data and measurement inaccuracies. As software we use R and SAS. Our services
- Consulting and conception for data analysis systems
- Execution of descriptive statistical analyses
- Creation of graphics (also web-capable)
- Automated report generation
- Statistical significance testing
- Statistical modeling
We use a wide range of statistical methods.
Statistical methods
- Descriptive methods
- Sampling methods
- Statistical Design of Experiments
- Methods for statistical modeling. These include for example:
- Generalized Linear Models (GLM, GLMM)
- Mixed Models
- Generalized Additive Models (GAM and GAMM)
- Generalized Estimating Equations (GEE)
- Latent Class Models
- Regression Trees
- (multifactorial) ANOVA
- Principal Component Analysis
- Factor Analysis
- Cluster analysis
- machine learning
- Event time analyses
- Time series analyses
- Nonparametric methods
- Methods of spatial statistics (point pattern analysis, kriging,...)
- Network analysis
- Stochastic Simulation / Markov Chains
Visualization
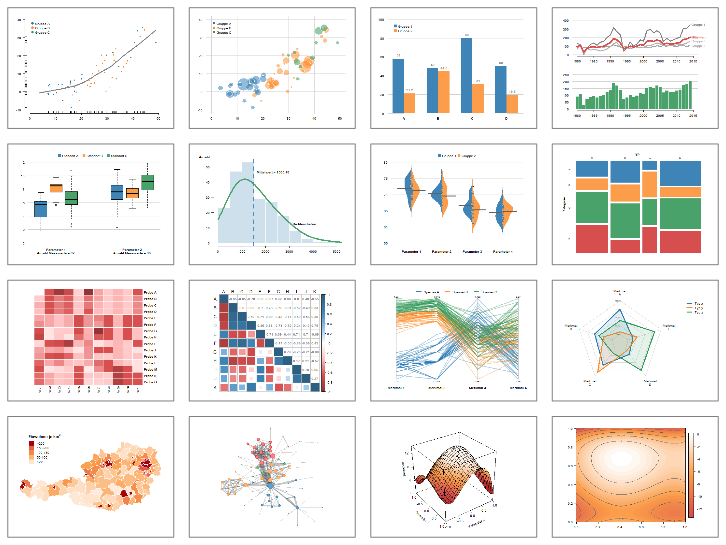
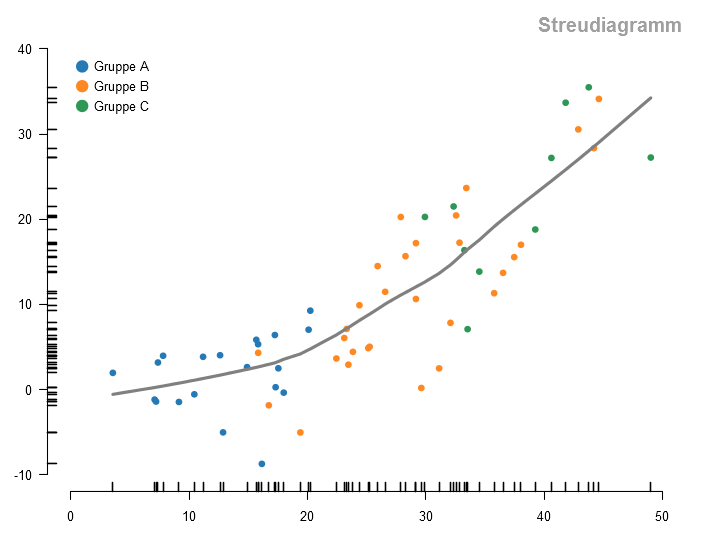
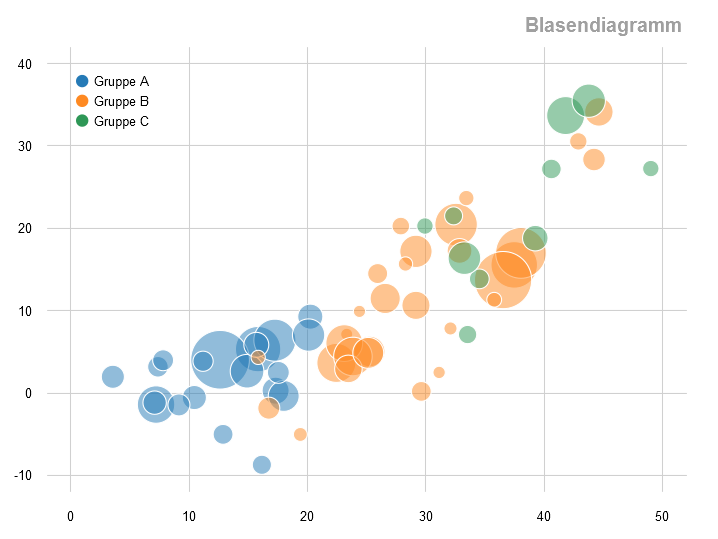
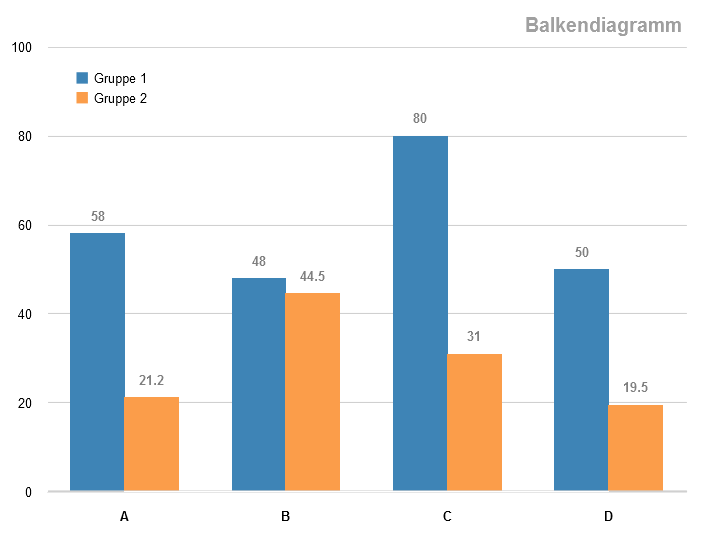
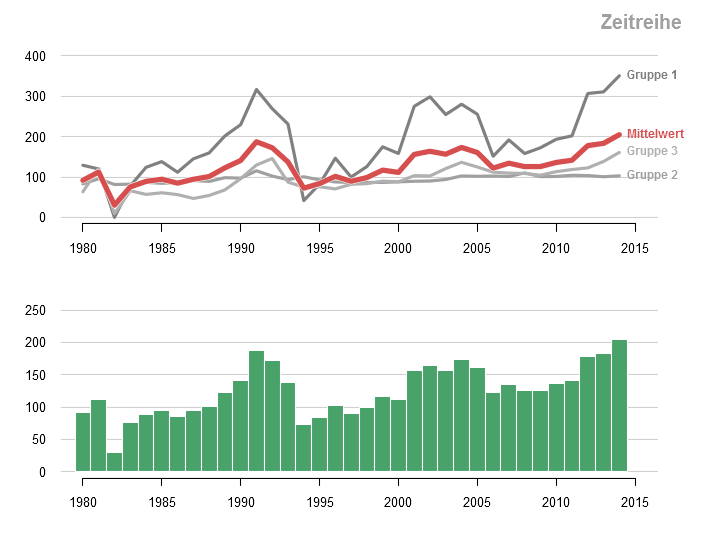
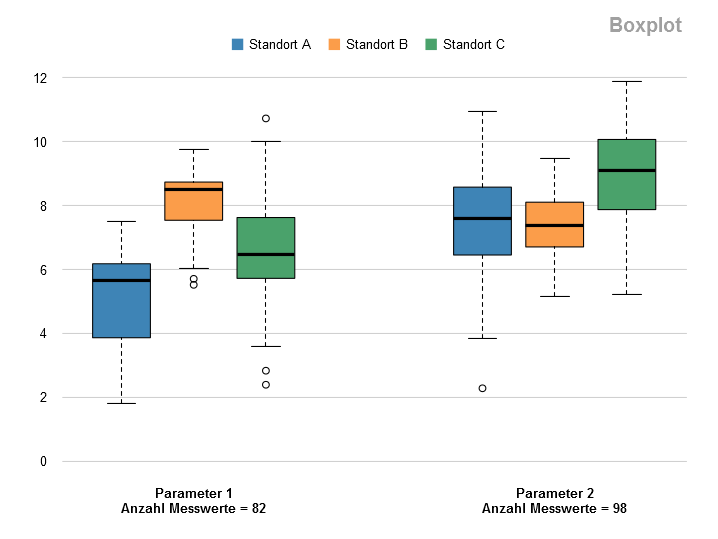
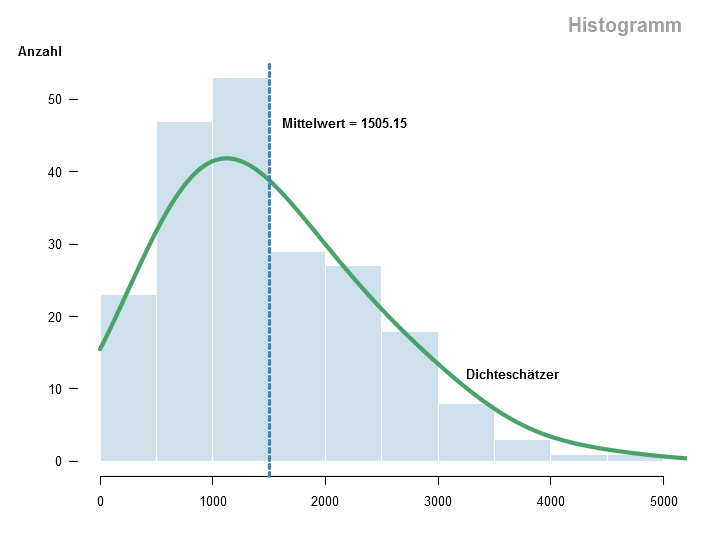
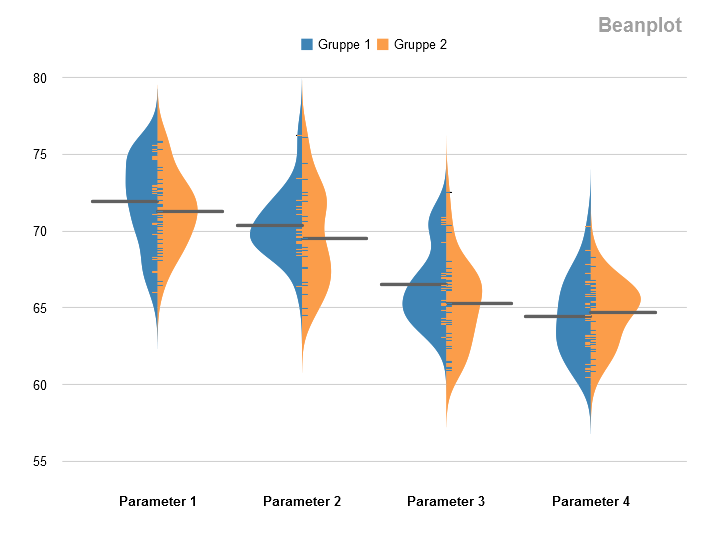
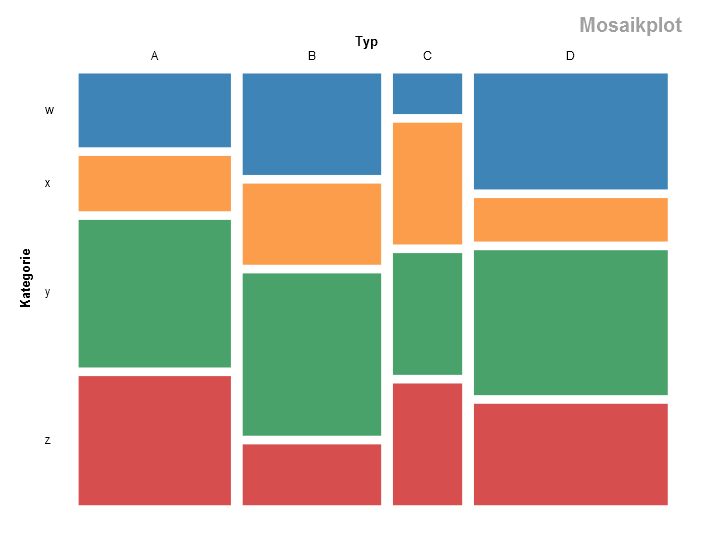
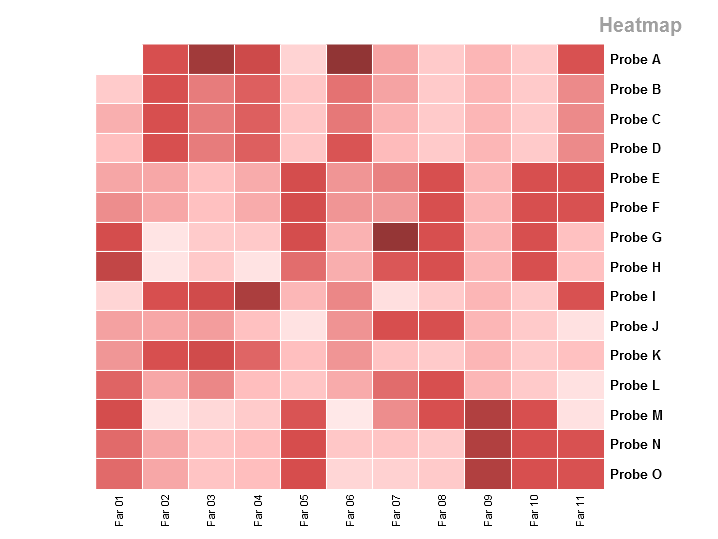
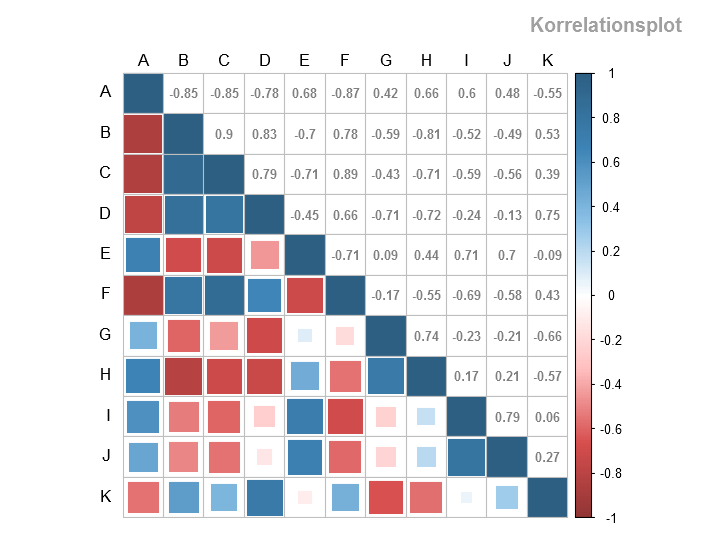
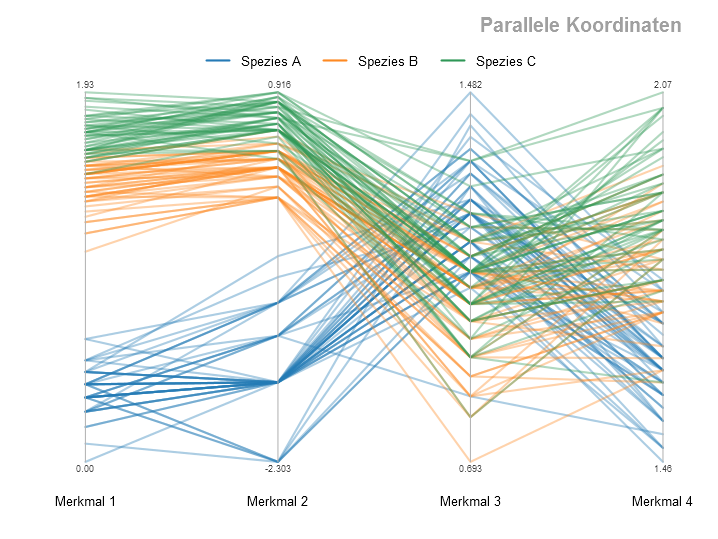
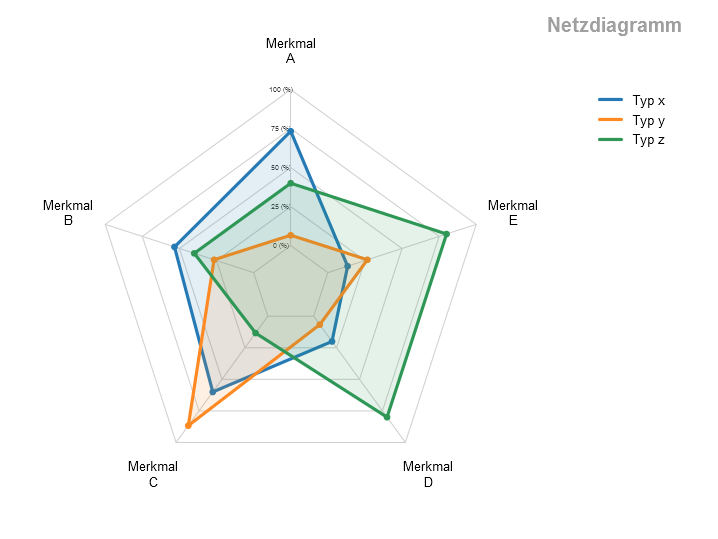
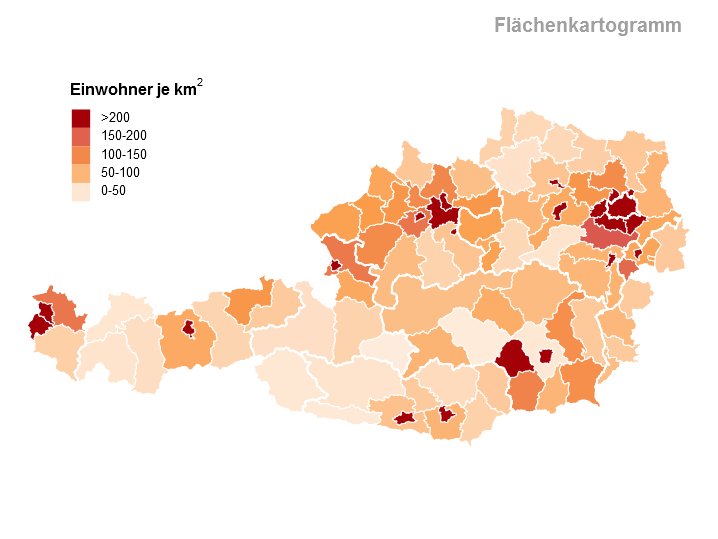
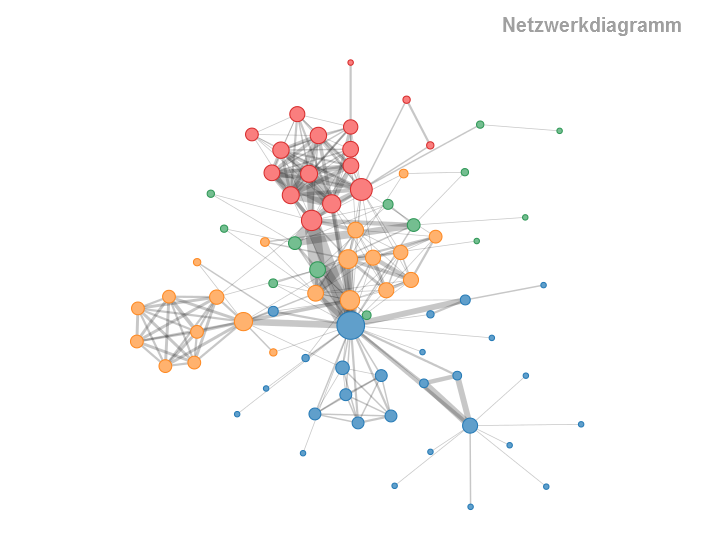
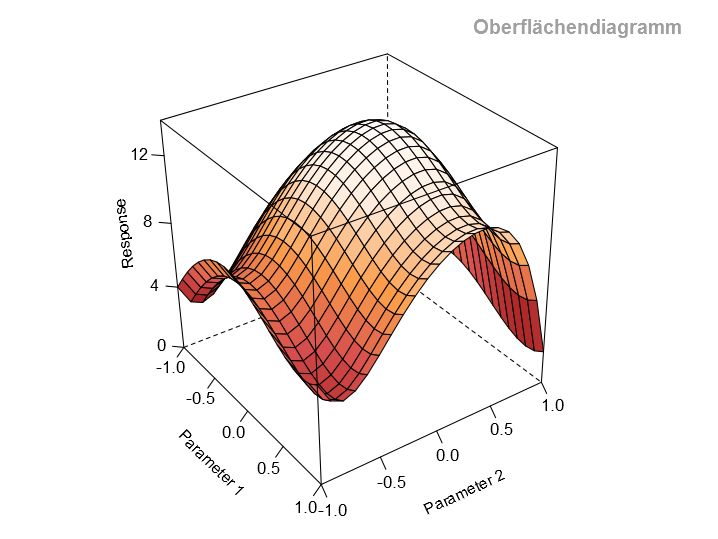
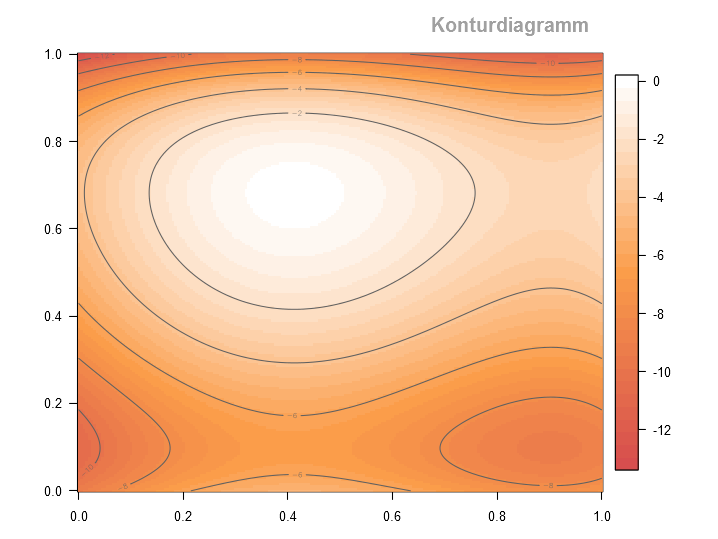
The graphical representation of data plays an important role in the exploration of regularities as well as in the description and communication of analysis results. In the exploratory phase of data analysis, suitable visualization techniques make it possible to quickly obtain an overview, even with very large amounts of data, and to identify trends, correlations, patterns and deviations. When communicating the results of statistical analyses, suitable forms of visualization are important so that relevant messages can be conveyed effectively and important aspects can be grasped quickly. Particular attention must be paid to an undistorted and clear presentation in order to avoid erroneous conclusions due to misleading presentation of results. We offer support in finding the right visualization form for the data and tasks at hand from a wide range of graphic types. Adhering to common visualization standards, we produce high-quality graphics for reports, presentations or publications. Some common graphic types from our range of services are described below
Risk modeling
Risks for humans, animals or plants are not equally distributed, but always depend on certain influencing factors. Identifying these and correctly assessing their quantitative significance is important for educational work and risk management. A good picture of the main risk factors is, for example, the basis for efficient risk-based control systems, for the design of legal frameworks or for targeted information activities. The statistical assessment of risk factors is based on data, mostly from official control activities, observational studies or experimental trials. With the help of suitable statistical methods, the influence of possible influencing factors on the target variable of interest is investigated. As software we use R and SAS. The central questions in risk modeling are:
- What are the significant risk factors?
- How do these factors quantitatively affect risk or an observed measure of interest?
- What risk can be predicted for specific population groups?
- How much can risk be reduced through interventions?
We can provide several services in this regard:
- Creation of a sample or study design to collect an appropriate data set.
- Statistical modeling using a wide range of methods
- Development of prediction models taking into account measurement uncertainties and sampling errors
Dispersion models
The spread of diseases in humans, animals or plants represents a risk potential. In combating disease outbreaks, efforts are therefore made to detect them as early as possible or to prevent their occurrence in advance. Here, surveillance programs and preventive measures play an important role. At the same time, however, precautionary considerations must also be made in the event of an actual disease outbreak, so that appropriate measures can be taken efficiently in the event of a crisis. For both tasks, the estimation of a possible disease spread in the form of computer-based simulation models represents a valuable tool. The basis for this is sound statistical risk modeling, which depicts the relationship between risk factors and the spread. Since random influences are always involved in reality, random disease spread is simulated using stochastic simulation methods. The analysis of these simulation results can be used in many ways - especially for the evaluation of surveillance and intervention measures. We can offer the following services for this complex of topics:
- Simulation of disease outbreaks (human, animal)
- Spread simulation for plant diseases, pests as well as harmful plants
- Visualization of disease spread in space and time
- Evaluation of the effectiveness of risk management measures
- Derivation of preventive monitoring programs
- Crisis scenario-oriented evaluation and reporting systems
GIS-Services
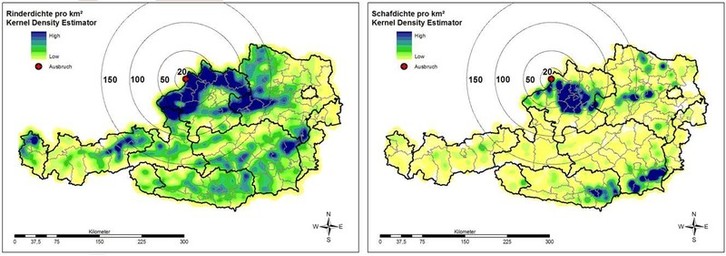
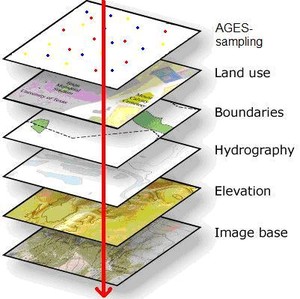
The spatial-geographical component plays a particularly important role for numerous questions, for example in the spread of diseases or the spatial distribution of pollutants. The cartographic representation opens up new perspectives of interpretation. It helps to identify spatial trends in advance in order to take appropriate measures in time. The "GIS Service Center" established at AGES supports all business areas in the processing of geographic data in order to achieve maximum protection for humans, animals and plants. Spatial analyses and maps are produced, for example, in the course of publications, research projects and reports, right through to interactive map displays on the AGES homepage. We also offer our GIS services outside AGES.
Cartographic representations
Service description
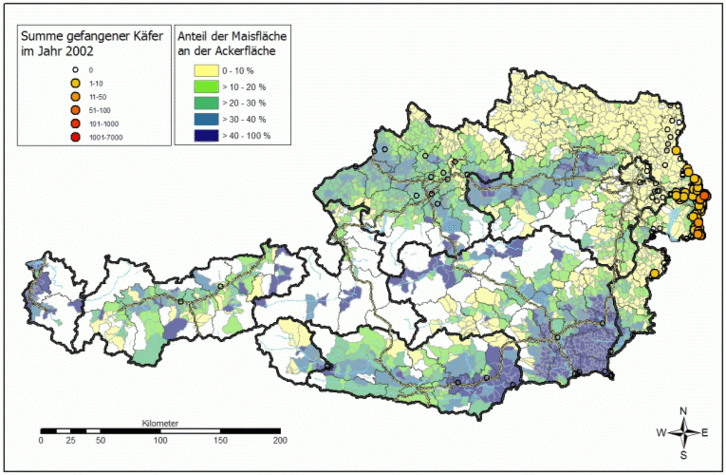
Specific spatial locations are assigned to specialized data (geo-reference) and these are then fed into a geoinformation system together with geobase data. Cartographic representations are intended to make abstract, spatial data and spatial relationships that are difficult to formulate easily comprehensible to the viewer. Using WebGIS technologies, interactive maps can be placed on the Internet. With the help of geoinformation systems, among other things
- maps of risk areas can be created
- space-time analyses can be displayed as animations
- results of monitoring programs can be shown in map form
- plan and refine control and sampling plans
Spatial analyses
Service description
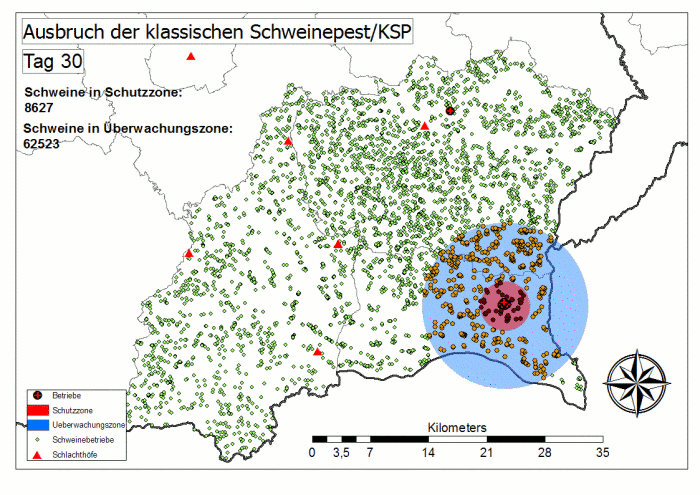
By blending a wide variety of data and geostatistical analyses, new information and correlations can be found and revealed by means of a digital map. Analyses can reveal circumstances and connections that would otherwise have remained invisible. GIS encompass both functions of geometric and geostatistical analysis on a large scale. The functions of spatial analysis include.
- Classifications
- Distance calculations
- Intersections
- Buffer formations
Reporting
The processed data from the laboratory information system as well as externally supplied data are prepared and made available to specific target groups, depending on the requirements of the recipient. The spectrum of reports ranges from standardized evaluations that can be called up directly by the user in the evaluation/analysis tool, to periodically sent reports in the desired file format, to extensive publications. We have an up-to-date tool mix that optimally supports this wide range of analysis and evaluation options.
Automated report generation
Service description
Our reporting serves a wide variety of stakeholders, ranging from AGES management to ministries, state authorities and European agencies. Together with the client, the objective and purpose of the evaluation are discussed in order to provide the desired information with pinpoint accuracy on the one hand and to adapt the design of the report to the reader on the other. Various tables and graphs enable a quicker grasp of the data situation and the derivation of trends and developments. We are very familiar with the basics of scientific work and can deliver reports ready for publication on request.
Partner in research projects
Service description
Our expertise in statistics and data management flows into numerous research projects. On the one hand, we are a supporting partner in research projects carried out by our colleagues in the business areas of food security, food safety, public health, animal health, medical market surveillance and radiation protection. On the other hand, we also act in the role of project manager and coordinator and carry out projects on a national and international level. In addition to the necessary technical expertise, we also have staff with many years of project experience. The planning, acquisition, management and implementation of projects is thus one of our main fields of activity.
As a partner, we can contribute the following competencies to research projects:
- Experience in the planning and management of projects
- Consulting for survey and study design
- Assistance for the construction of databases
- Preparation of statistically sound sampling plans
- Comprehensive data analysis: descriptive analysis, visualization, statistical modeling
- Automated analysis and reporting systems
Training & Lectures
We are also happy to share our expertise in statistics and data management through presentations and training activities. The content is tailored to the wishes and needs of our customers. In particular, we offer the following services:
- Statistical consulting for questions of data evaluation and survey planning
- Lectures
Contact
Leitung
Mag. (FH) Monika Goebel
- monika.goebel@ages.at
- 43 50 555 25715
-
Spargelfeldstraße 191
1220 Wien
Leitung
Mag. Dr. Hans-Peter Stüger
- hans-peter.stueger@ages.at
- +43 50 555 61401
-
Zinzendorfgasse 27/1
8010 Graz
Last updated: 10.10.2023
automatically translated
